Popcorn Anyone? Cox's Advanced Visualization Lab Makes Science Data As Much Fun as the Movies
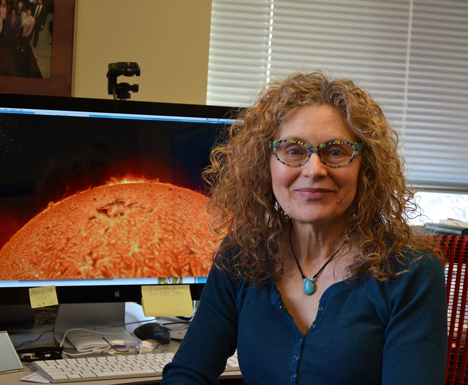
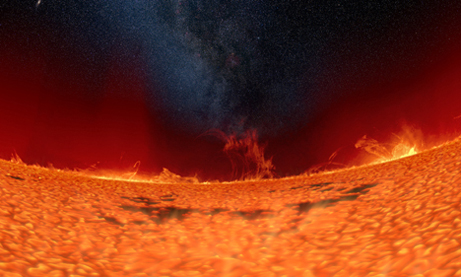
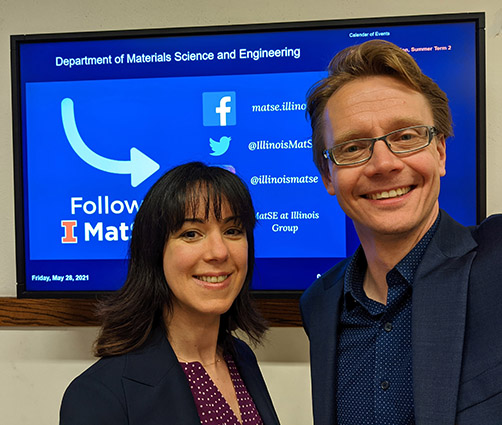
Donna Cox, Director of the Advanced Visualization Lab. On the monitor behind her is the AVL's visualization depicting the sun's surface.
March 31, 2014
At my heart and soul, I am really a graphic information designer, and that’s primarily what I do—it’s like being an engineer of information, only visually putting it out there." Donna Cox, Advanced Visualization Lab
There’s an old saying, "A picture is worth a thousand words." However, comparing a picture to the visualizations that Donna Cox, the Director of the Advanced Visualization Lab, and her team produce is like comparing Alexander Graham Bell’s original invention to an i-phone: while they might perform the same basic function, the latter, with its bells and whistles, is a whole lot more fun. But while one picture can tell a story, Cox’s multi-sensory, 3-D, high-def motion picture experiences present the essence of copious amounts of technical data in an unforgettable, yet totally accurate, manner. While entertaining, these visualizations are highly useful to help scientists and decision-makers understand large data sets, as well as for both formal and informal teaching and learning.
Surprisingly, for someone who produces motion pictures, Cox is quite enamored with numbers—specifically numerical models—interpreted visually, of course.
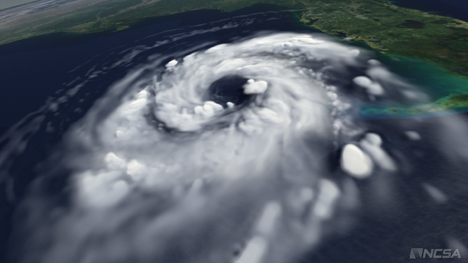
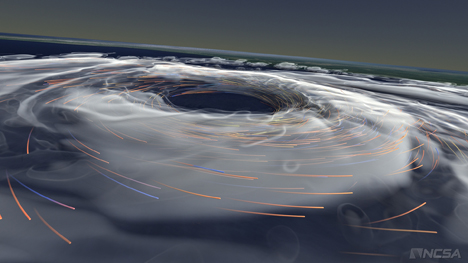
AVL's visualization of Hurrican Katrina helps scientists understand how hurricanes form. (Photo courtesy of the AVL.)
"Numerical models are essential. They help us design our cars, our financial systems, our stock markets. All of these are numerical models that are evolving or predicting. And the best way to understand what’s going on is—out of the numbers —creating visuals. And especially if it’s a 3-dimension model of traffic or something like that. We need to understand how this all works in a spatial domain over time."
She describes how their visualizations enable study of the universe, such the one which condenses data about the evolution of the universe into a few minutes:
"What these numerical models give us is the capability of collapsing two billion years into a minute and a half and understanding all the dynamics that yield the universe as we know it today. We understand today how it was born, how it’s evolving, and how our own Milky Way Galaxy is moving by studying it through numerical models."
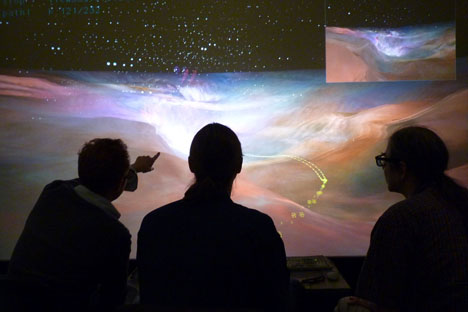
Members of the AVL staff work on the Orion Nebula visualization. (Photo courtesy of AVL's website.)
The idea a video production based solely on a huge data set, for example, such as the enormous amounts of data generated by an instrument like the Hubbel Space Telescope is hard to wrap one’s mind around, especially for those of us who have been jaded by Hollywood productions, where a great deal of license is taken. So after viewing part of the Hubbel 3D project, the trip through the Milky Way to Orion Nebula, this reporter was curious as to how much of the film was actually based on data. Cox was quick to explain: all of it.
"We worked with Space Telescope Science Institute. We brought Hubbel data here; we worked with that NASA team, to properly locate and build the Orion Nebula, with the best scientific knowledge that we have. But to the best of our knowledge, in 2014, that data is positioned based upon computations and telescopic imagery. It was all accurately located." She added that the colors used were even based upon Hubble images.
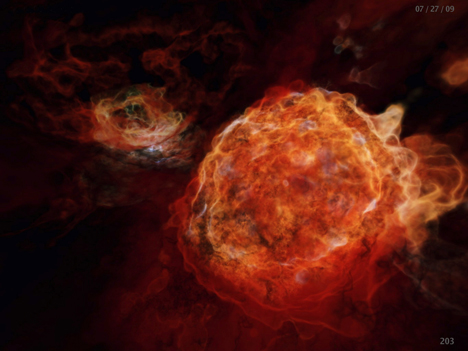
An image of a supernova. (Photo courtesy of AVL's website.)
Besides the visualization described above, where the viewer careens through the Milky Way galaxy to the Orion Nebula, other data sets the Lab has tackled include a number of stunning visualizations depicting the universe (move over, Star Trek), addressing phenomena such as black holes, supernovas, quasars, and nebulas; the formation of galaxies and proto-planetary discs; and the sun’s solar flares.
The Lab also tackles subject matter a little closer to home: planet earth and climate change; ocean currents, including two projects on Monterey Bay currents; weather-related phenomena, such as tornadoes and hurricanes (see the AVL's visualization of Hurricane Katrina forming); and traffic patterns in the sprawling metropolis just north of I-80.
While some renderings might last only minutes, distilling large data sets into a visualization capturing the most important trends is a lengthy, multi-stage process, which they’ve developed into an art form (or a science). Cox describes their "modern pipeline of the last 15 years:"
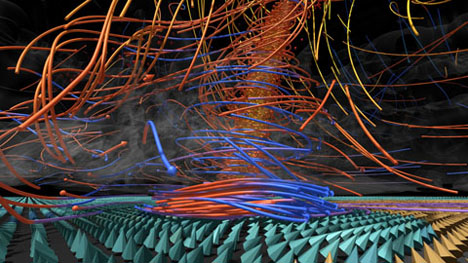
An image of a tornado vizualization created by the AVL. (Photo courtesy of AVL's website.)
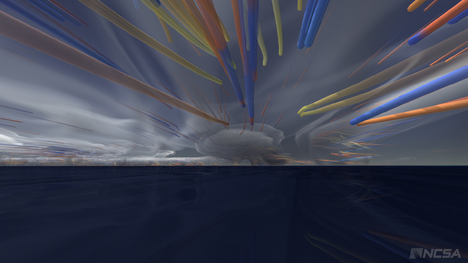
Above and below: images taken from the visualization of Hurricane Katrina forming. (Photos courtesy of the AVL.)
"First the scientist generates supercomputing data that has embodied in it all of the physics of that phenomenon," says Cox. Then they explore this block of numerical data, transforming it into something usable, then develop "advection algorithms to discover the flow of the geometry of the computational fluid."
In layman’s terms, scientists garner a whole lot of data about the phenomena they are studying (let’s say a tornado). Cox’s analogy compares these raw data to "this big box of spaghetti that’s all been cooked." ) So AVL’s next step is to filter the data to isolate key parts of that flow that "contribute to the tornado or feed the hurricane."
In the next section, they generate derivative data, then render it graphically to show the geometry of flow. In the case of the tornado, they depict key air currents as tubes. "It’s like any tube in computer graphics," says Cox, "but we’re having data run those tubes."
Their final step is cinematography; they choreograph and render the presentation itself. According to Cox, during this step, how the data are presented is at the artists’ discretion: "We have artistic license with how we take the audience through the data, how we develop the cinematic presentation of that, where to take the camera. Those are artistic choices. That’s why we say it’s the cinematic presentation of science."
Finally, after the movies are made in different formats, scientists then vet the rendering: "We might have to iterate or modify, or fix things up one way or another."
Did Cox have an inkling, when she started out as an undergrad in the arts, that she would end up where she is today, transforming gigantic sets of scientific data into visual presentations? Actually, yes.
"Well, I hoped to be," qualifies Cox. "I did have that epiphany in undergraduate school—it was truly an epiphany—that computer graphics was really going to be important. Because back in 1983, computer graphics was just being born, but you could make images with computers and that could be driven by data. I just saw that that was going to be the place to go. To be able to do this for museums and IMAX movies, that I didn’t think about. This has been truly a wonderful adventure."
While Cox is actually a professor in the School of Art and Design, she works in NCSA, and the AVL is housed there. So how did a nice girl from the arts end up north of Green Street collaborating with scientists? Another epiphany. In graduate school, she had already started collaborating with scientists, and saw that computer graphics as a technology "could bring together a shared language between artists and scientists."
"I believe visually literate people have something to contribute to science," Cox preaches, and she practices it. Through AVL, she has carved out for herself an indispensable niche in the scientific community.
After working with scientists, day-in, day-out, for most of her career, does she still consider herself an artist, or a sort of hybrid—part artist, part scientist, and part technology geek?
"I am still an artist, and that’s the role I play," says Cox. "But I also share knowledge now as a result of working on a team on a complex problem. So I’ve learned a lot of technology. I’ve learned a lot of different science and different domains. But at my heart and soul, I am really a graphic information designer."
But Cox is the first to admit that what she and the AVL do takes teamwork. A proponent of interdisciplinary collaboration, she describes herself as "an artist working in a collaborative team of experts from the sciences, from technologies."
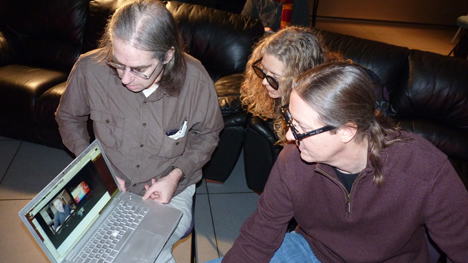
Stuart Levy, Donna Cox, and Bob Patterson collaborate with a client during a project. (Photo courtesy of the AVL.)
"I really believe in the value of collaboration. I have preached the gospel of renaissance teams in collaboration as a methodology for success—interdisciplinary teams that bring together many disciplines and address socially-related challenges. But in the case of the renaissance team I work with, we’re addressing scientific visualization challenges, primarily."
Regarding collaboration, once again, she and the Lab practice what she preaches. They have collaborated with scientists and researchers from just about every unit on campus, as well as from across the country.
The list of organizations they’ve worked with is like a who’s who of the big names in their respective fields: space research (such as, National Center for Atmospheric Research, Hubbel, NASA, Space Telescope Science Center) and computing giants (Apple, Microsoft, and Google).
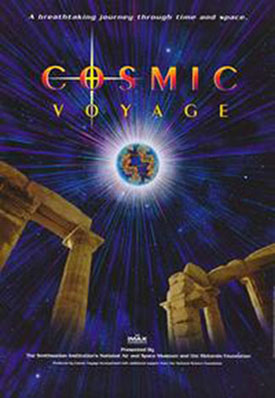
Their work has also been viewed in numerous venues (Chicago’s Adler Planetarium, Museum of Science and Industry, and the Kennedy Center for the Performing Arts, to name a few), been aired on tv (Discovery Channel, National Geographic, PBS, CNN, and NBC), and at the movies (iMAX’s Hubble 3D, Cosmic Voyage, and The Tree of Life).
Their collaboration with Hollywood has involved rubbing shoulders with the likes of filmmaker Terrence Malick (Tree of Life); other projects included voiceovers by Leo DeCapprio and Morgan Freeman (everyone's favorite; it's his voice).
Speaking of rubbing shoulders with Hollywood, Cox has trod the red carpet at the Oscars—twice. In 1996, two former students nominated for an Oscar invited her because it was she who had turned them on to computer graphics. "So I got to walk. I borrowed my friend’s daughter’s prom dress," confesses Cox. While the first trip might have been an honor achieved vicariously, the second was earned on her own merits: in 1997, the 1996 iMAX movie Cosmic Voyage was nominated for an Oscar. For that second stroll down the red carpet, she decided, "’Maybe I should go buy my own dress.’ I guess I didn’t take it seriously the first time, and then I thought, ‘How many times do you get to be a professor in Illinois and walk the Oscars two years in a row?"
So are the vizualizations Cox and the AVL create science or art? Cox would say both. Cox sees her field—data visualization technology—as a unique hybrid—"a bridge between art and science." And this new genre has numerous applications and a number of audiences.
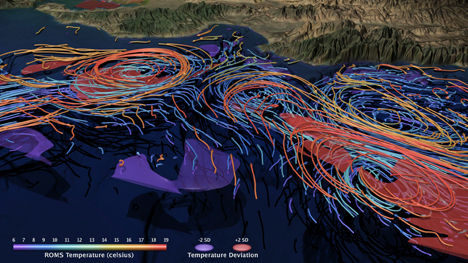
This image taken from AVL's visualzation of Monterey Bay done for the Navy shows temperature differences the the water. (Photo courtesy of the AVL.)
For example, their Monterey Bay Ocean Flow visualization, which Cox calls "very interactive," helped decision makers during a recent experiment by the Navy, which was using autonomous vehicles to sample water temperatures in Monterey Bay. Data were fed into the numerical model, run, then visualized to help them decide where to place vehicles the following day.
Another AVL project is helping to solve Chicago traffic jams. Consider this scenario: Decision makers tasked with regulating Chicago traffic flow are being completely overwhelmed by the sheer numbers on page after page of traffic pattern data; however, after viewing this visualization depicting areas where traffic consistently flows freely and others consistently plagued by traffic jams of long duration, decision makers can visually see and note the times, durations, and places the bottlenecks occur, then plan a course of action.
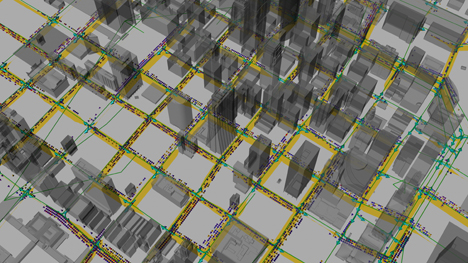
An image of the AVL's Chicago traffic patterns visualization. (Photo courtesy of the AVL.)
So can high-fidelity, high definition, 3D data-driven visualizations complete with surround sound and seat-rattling subwoofers actually be considered learning tools? Cox would say, "Absolutely."
Cox sees her products as effective learning tools, including for people who are visual:
"Visually-oriented people can also use visualization as a learning mechanism to understand more about science, math. So visualization is a key here."
Thus, the Lab’s products are useful for formal education—the classroom; Cox says they don’t teach classes, but support them by providing visuals—materials instructors can use in both classrooms and online courses. "So they can use our Colliding Galaxies as part of an astrophysics course;" suggests Cox. "Or they can use our tornado as part of an Atmospheric Science course."
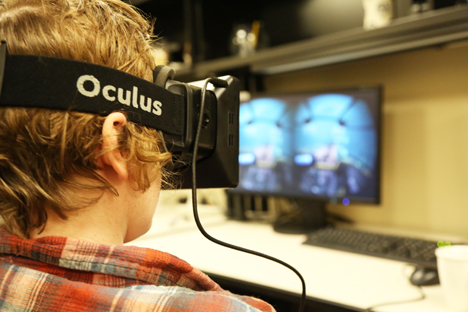
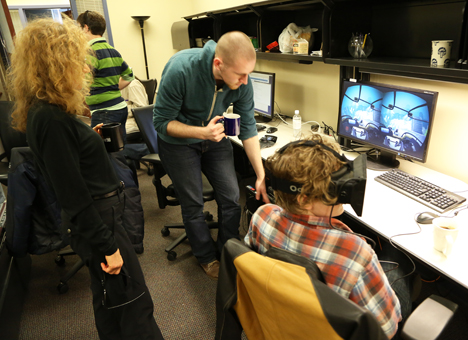
Above: a student using the Oculus equipment in the AVL. (Photo courtesy of the AVL.)
Below: Donna Cox and Coulter supervise the student using Oculus.
According to Cox, another role is to "enhance the student’s experience at Illinois." They help students from programs such as Capstone (Computer Science students), SPIN (Students Pushing Innovation), and ICubed come up with projects or propose innovative projects, then work with them. Besides benefitting from the expertise of AVL staff, who practically wrote the book on data visualization technology, students have another perk: access to the Lab’s state-of-the-art facilities.
To facilitate Cox’s dream of passing the baton to the next generation of digital artists, Cox and company created eDream (Emerging Digital Research and Education in Arts Media). The institute enables them to bring together and mentor up-and-coming digital arts students.
Cox also perceives their work to be an invaluable tool for informal education. So do numerous museums and planetariums across the country who have presented or are currently presenting the AVL’s work as part of their exhibits. Cox believes it is her group’s mandate to help institutions like these educate the public informally:
"Our purpose in our group is to use visualizations as a way of informing and inspiring the general public."Their method is just a little more advanced than your run-of-the-mill museum exhibit. And their multi-media approach is tailor-made to especially target youngsters and, hopefully, like a modern-day Pied Piper, lure them into STEM.
She quotes colleague, Robin Sip, who says, "‘We want to make people so awed that their jaws drop, and then we want to stuff them full of science."
And that’s exactly how Cox thinks about it. "I want to just make their jaws drop," she says, "and then I want to give them as much science and inspire them with the great stories of science and our discoveries. And how important it is to inspire young people, especially, to go into the areas of science."
But getting to turn boring data (yawn) into cool movies isn’t Cox’s only motivation for getting out of bed in the morning. Most people might find making science more easily understood and learned by a broad range of audiences to be a rewarding enough life’s work. However, Cox has even bigger goals. For example, she envisions how her work could help her fellow man by saving lives.
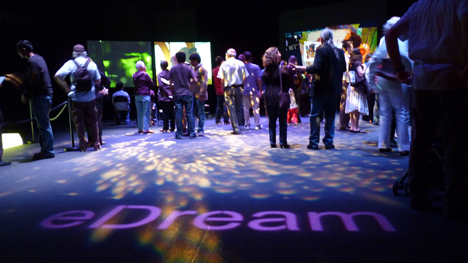
Visitors enjoy eDream's interactive experience, Festividad Digitale at Krannert Center in 2010. (Photo courtesy of the AVL.)
Cox says scientists studying tornadoes and hurricanes, "tend to look at visuals to understand and to make predictions." The AVL’s visual feedback helps weather forecasters understand how these phenomena develop and understand what feeds a storm—the probability that a storm could become an F3 tornado or killer hurricane like Katrina. "These visualized numerical models enable the scientists to inform the public and possibly save lives."
Finally, Cox also dreams of helping save the planet. "With climate change, the only way to predict and modify our behavior, and to predict things that are happening 50 years, 100 years into the future, is to use numerical models; and the best way to study them is through visualization."
Story and photographs (except where noted) by Elizabeth Innes, Communications Specialist, I-STEM Education Initiative.
More: Faculty Feature, NCSA, 2014
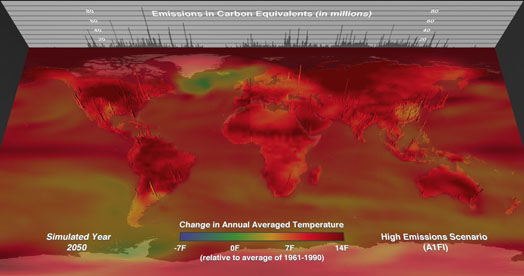
A photo of the earths carbon emissions taken from a the AVL's visualization. (Photo courtesy of the AVL.)
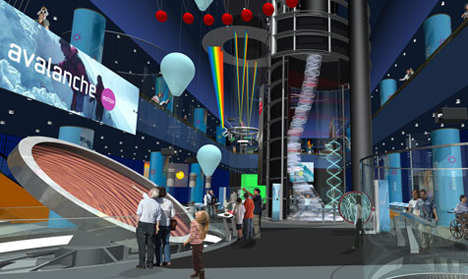
An image of the Museum of Science and Industry's exhibit in which the AVL participated, proviiding a kiosk on the science behind storms and included some of their visualizations. (Photo courtesy AVL website.)
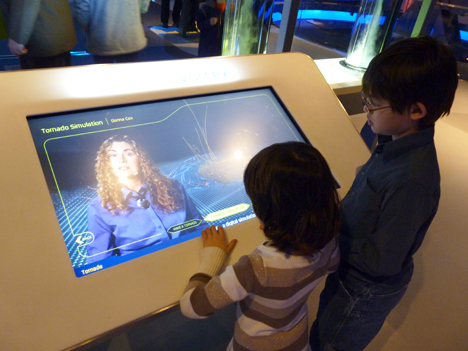
The children of AVL staff member Jeff Carpenter, Iain and Trinity, experience AVL's kiosk at the Museum of Science and Industry, where Donna Cox is explaining the science of tornadoes.
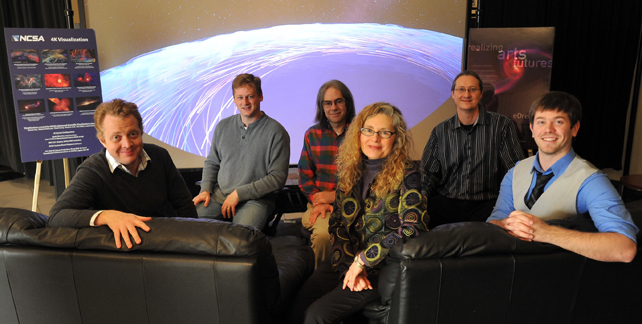
The Advanced Visualization Lab team (from left to right): Alex Betts (no longer at the AVL), Jeff Carpenter, Stuart Levy, Donna Cox, Robert Patterson, and A.J. Christensen. (Photo by Robin Scholtz, courtesy of the AVL.)
Our vision for Illinois as a land-grant institution is to foster accessible, effective STEM teaching and learning—from preschool through graduate education—at local, state, and national levels, thereby preparing a highly able citizenry and diverse STEM workforce to tackle pressing global challenges.
View I-STEM News
I-STEM Internship Opportunity
I-STEM is recruiting! We need enthusiastic undergrad and/or grad students for two roles, depending upon student strengths/interests.
Apply for internship here.


.jpg)